Show the code
library(tidyverse)
library(patchwork)
library(knitr)
library(DT)
library(plotly)
library(here)

options(scipen = 100)This report is an assignment of the Productive R Workflow course.
The goal is to build a Quarto report using a script that loads the palmerpenguins data set and performs an exploratory analysis.
We will load tidyverse, patchwork, TD, knitr, plotly and here in this report.
This report is done to showcase some of the Quarto features and it’s merely academic.
library(tidyverse)
library(patchwork)
library(knitr)
library(DT)
library(plotly)
library(here)
options(scipen = 100)The data is already loaded and prepared in our data folder, as well as some custom functions.
source(here("R/functions_learn_by_doing.R"))

penguins_data <- read_rds(here("data/data_clean.rds"))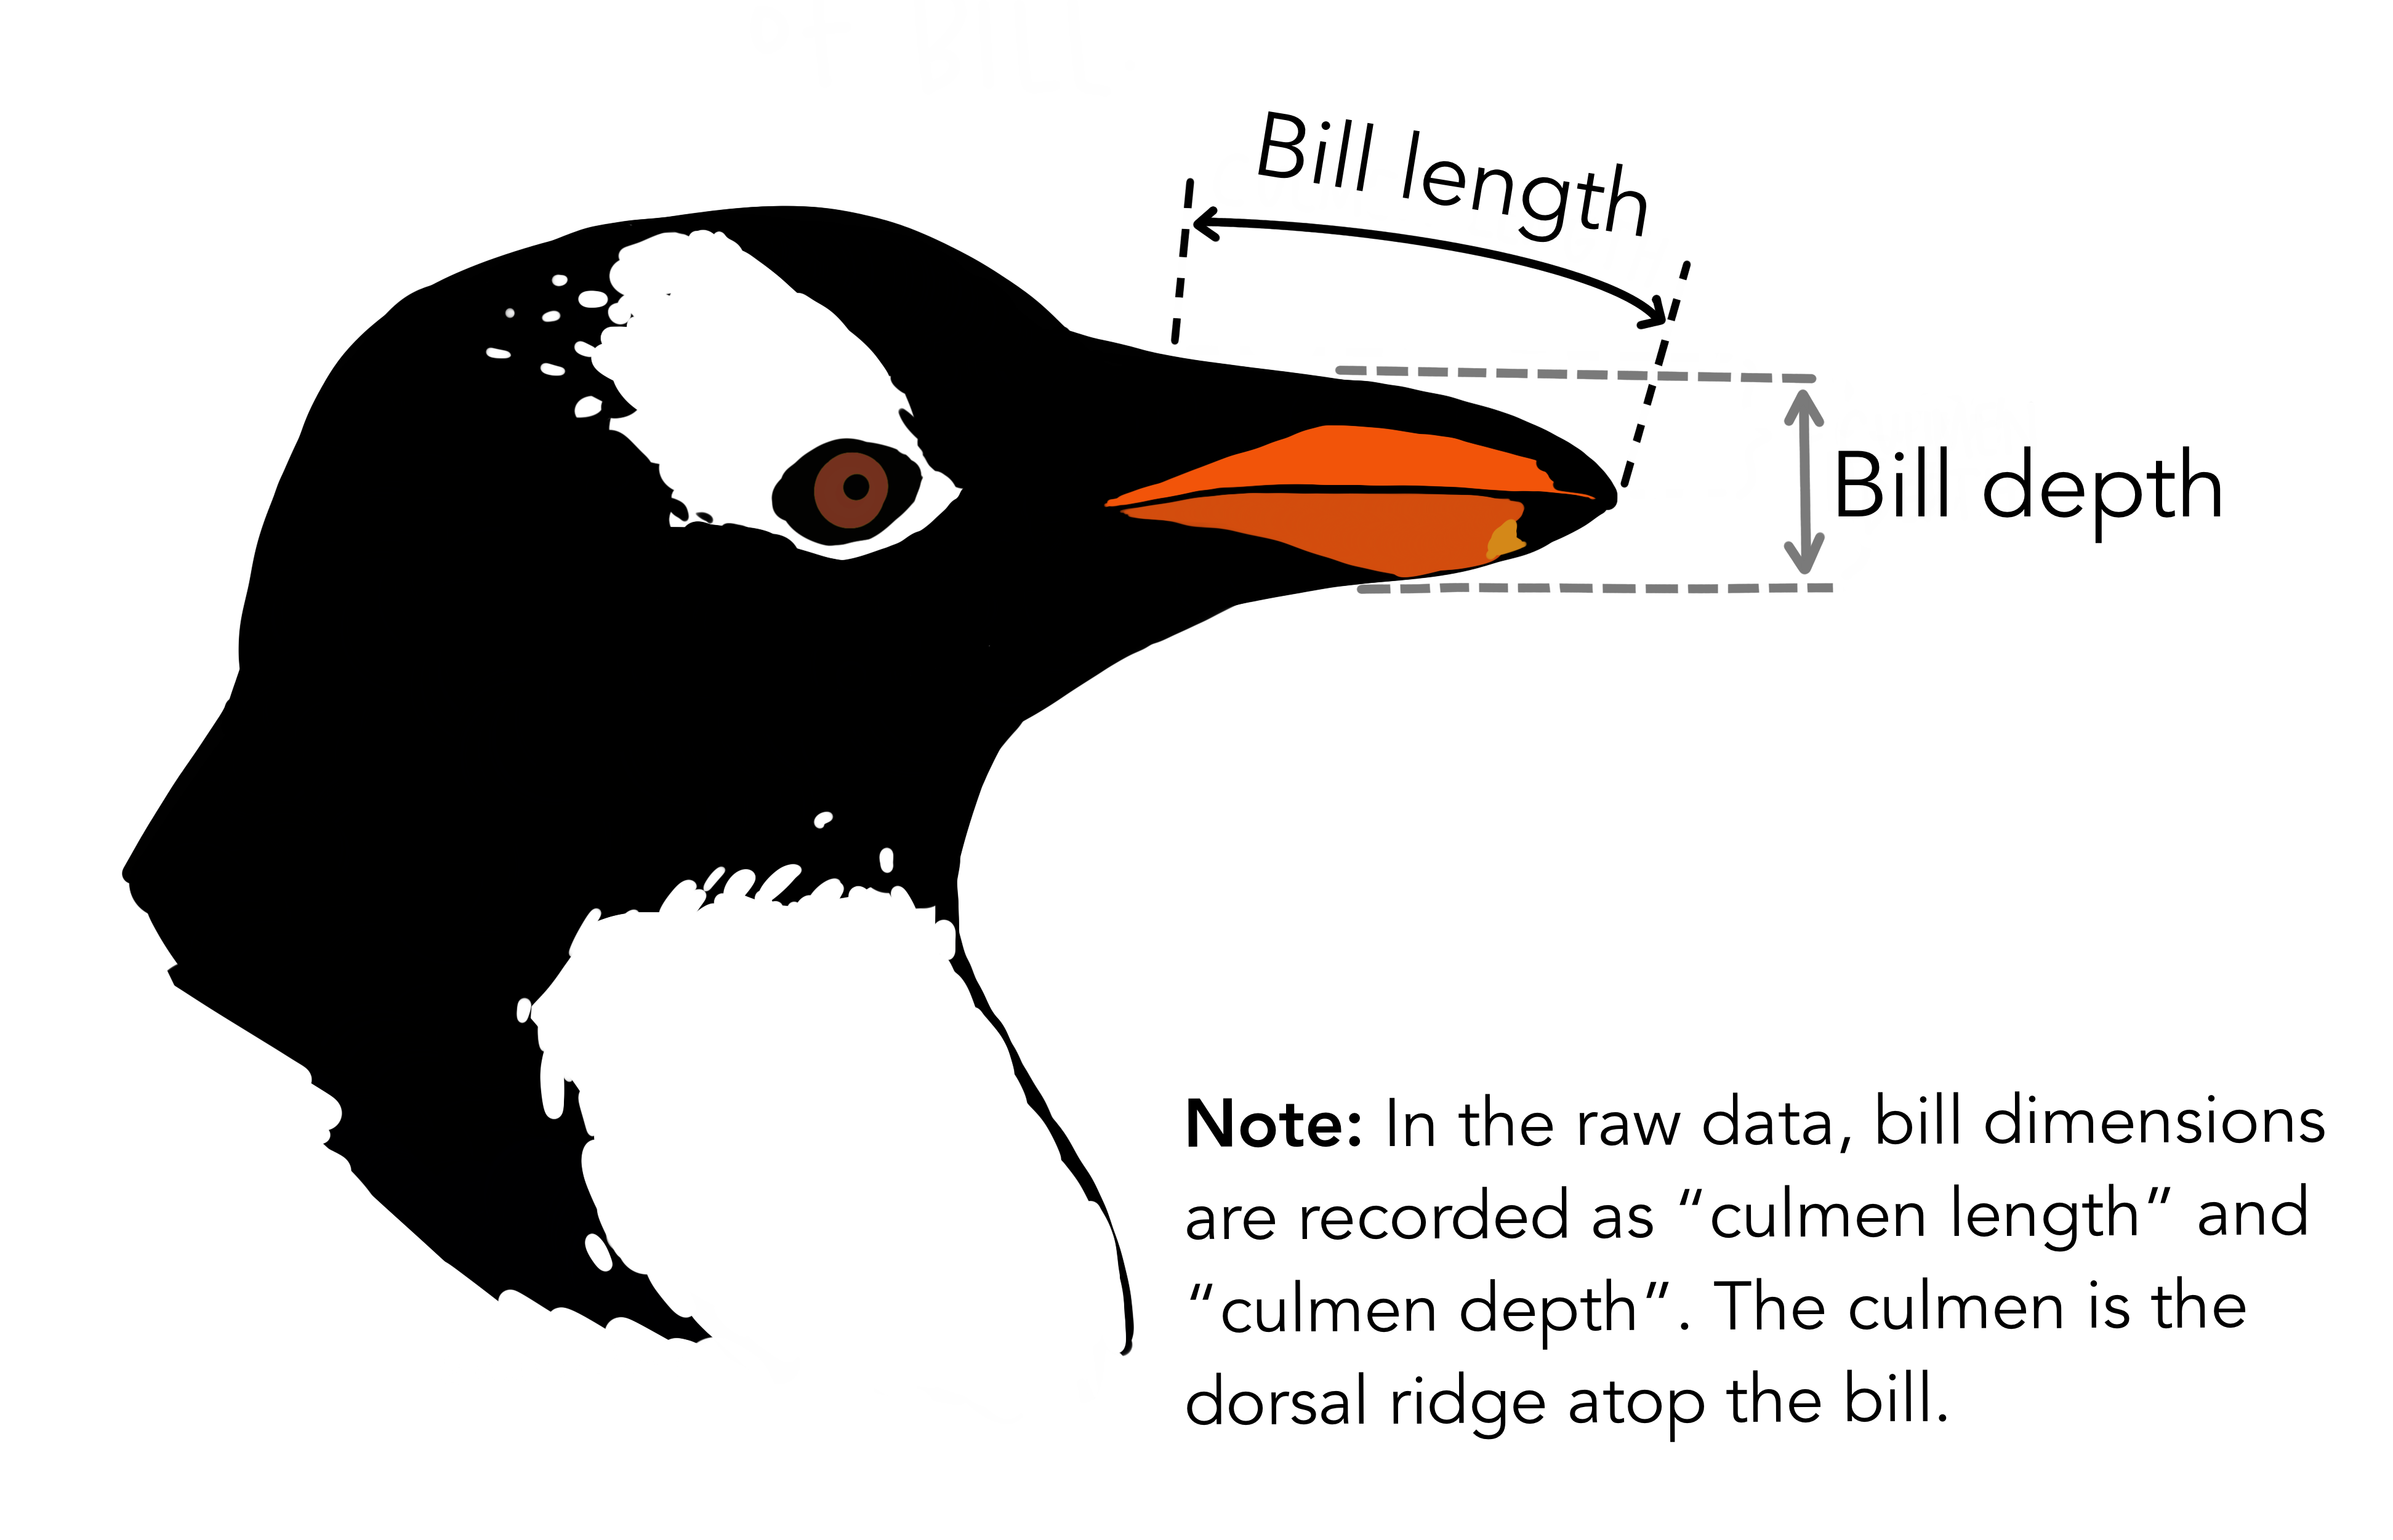
summary(penguins_data) species island bill_length_mm bill_depth_mm
Adelie :150 Biscoe :168 Min. :32.10 Min. :13.10
Chinstrap: 68 Dream :124 1st Qu.:39.27 1st Qu.:15.57
Gentoo :124 Torgersen: 50 Median :44.50 Median :17.30
Mean :43.96 Mean :17.14
3rd Qu.:48.50 3rd Qu.:18.70
Max. :59.60 Max. :21.50
NA's :2 NA's :2
flipper_length_mm body_mass_g sex year
Min. :172.0 Min. :2700 female:164 2007:110
1st Qu.:190.0 1st Qu.:3550 male :167 2008:113
Median :197.0 Median :4050 NA : 11 2009:119
Mean :201.0 Mean :4203
3rd Qu.:213.2 3rd Qu.:4756
Max. :231.0 Max. :6300
NA's :2 NA's :2 avg_bill_length <- penguins_data %>%
group_by(species) %>%
summarise(mean_bill_length = num(mean(bill_length_mm, na.rm = TRUE), digits = 2))
avg_bill_depth <- penguins_data %>%
group_by(species) %>%
summarise(mean_bill_depth = num(mean(bill_depth_mm, na.rm = TRUE), digits = 2))
kable(avg_bill_length)
kable(avg_bill_depth)| species | mean_bill_length |
|---|---|
| Adelie | 38.81 |
| Chinstrap | 48.83 |
| Gentoo | 47.50 |
| species | mean_bill_depth |
|---|---|
| Adelie | 18.34 |
| Chinstrap | 18.42 |
| Gentoo | 14.98 |
ggplotly(penguins_data %>%
  na.omit() %>%
  ggplot(aes(x = bill_length_mm, y = bill_depth_mm, color = species, shape = species)) +
  geom_point() +
  labs(title = "Penguin Bill Dimensions",
       x = "Bill Length (mm)",
       y = "Bill Depth (mm)") +
  scale_shape_manual(values = c("Adelie" = 16,
                                "Chinstrap" = 17,
                                "Gentoo" = 18)) +
  scale_color_manual(values = c("Adelie" = "#ff8100",
                                "Chinstrap" = "#c25ecb",
                                "Gentoo" = "#056e75")))
Length and Depth are negatively correlated when we look at all data points
p1 <- species_length_depth(penguins_data, "Chinstrap", "#c25ecb")
p2 <- species_length_depth(penguins_data, "Gentoo", "#056e75")
p3 <- species_length_depth(penguins_data, "Adelie", "#ff8100")

p1 + p2 + p3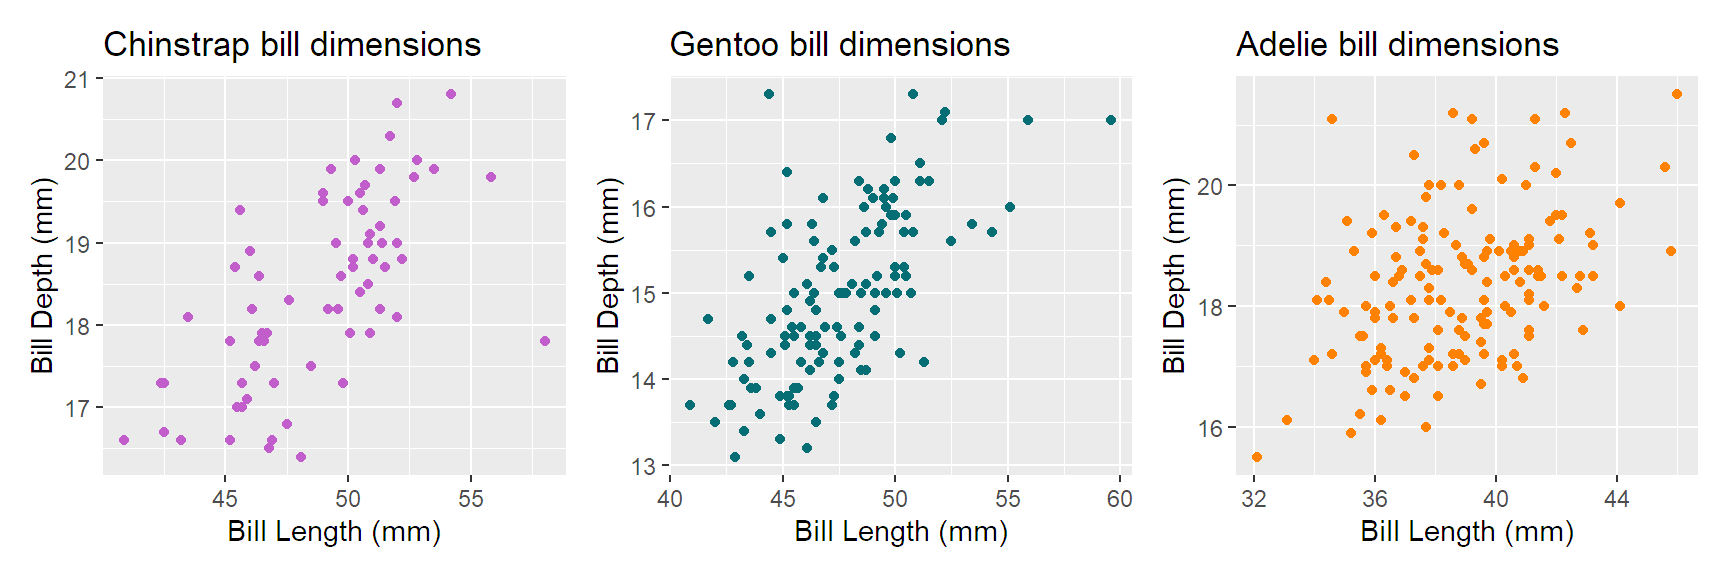
datatable(penguins_data,
filter = "top")
Horst AM, Hill AP, Gorman KB (2020). palmerpenguins: Palmer Archipelago (Antarctica) penguin data. R package version 0.1.0. https://allisonhorst.github.io/palmerpenguins/. doi: 10.5281/zenodo.3960218.